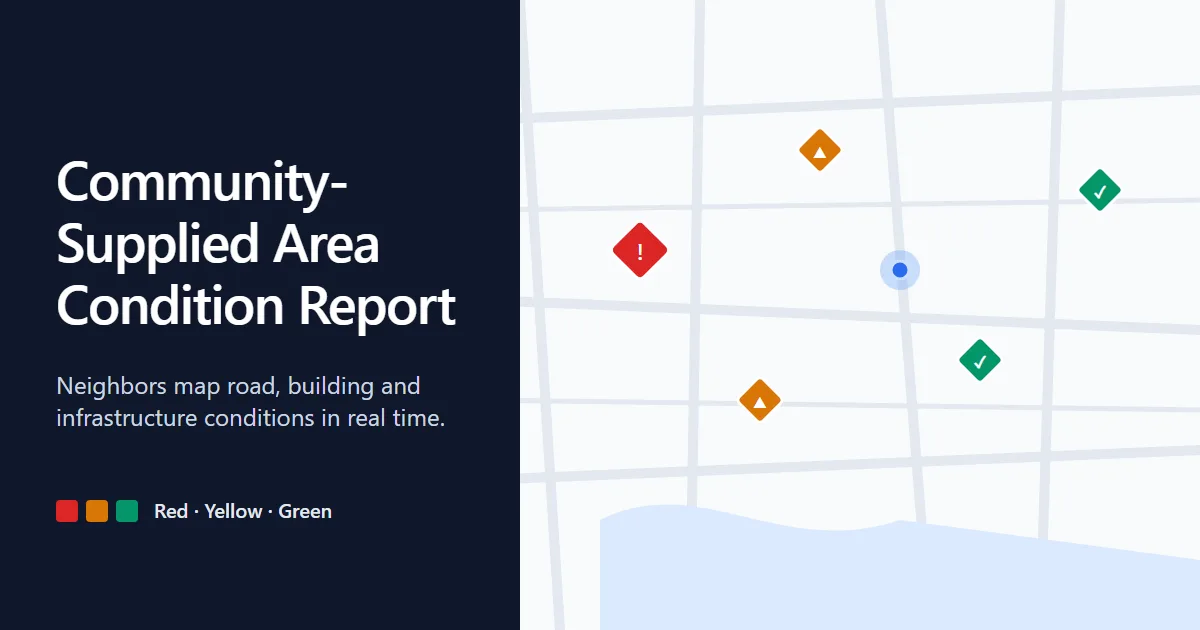
Community-Supplied Area Condition Report (CSACR)
Neighbors map road, building, house and infrastructure conditions in real time, so everyone can see what's safe, what's risky and what's been fixed.
Live at https://labs.inpsstudio.com/csacr
Why we use it
Official inspections are slow, and the people who live in an area usually notice problems first: a flooded road, a cracked wall, a fallen pole. CSACR gives residents one shared map to report those conditions in under a minute, with no account required, and gives moderators a queue to keep the data trustworthy.
- Faster awareness. Hazards show up on the map as soon as someone reports them.
- Low barrier. Browsing and reporting need no sign-in.
- Trustworthy data. Anyone can flag a bad report; admins verify, resolve or remove it.
- Useful when offline. The last loaded reports stay available if the network drops.
Features
For the public
- Interactive map. Leaflet map with Streets and Satellite views, your live location, and a marker for every report.
- Traffic-light severity. Red (severe), Yellow (warning), Green (clear), shown as color and symbol so it works without relying on color alone.
- One-tap reporting. Click the map or press Report to log a condition with title, category, description, coordinates, optional address, photo and name.
- Use current location. Fill in coordinates from GPS.
- Photo upload. Images are resized in the browser (max 1280 px, JPEG) before upload, so submissions stay small and fast.
- Filters. Narrow by severity and by category (Road, Building, House, Infrastructure).
- Community Reports feed. Searchable list with distance from you, date, status and flag state.
- Report details. Full description, photo, reporter, location and a Nearby tab with other reports around it.
- Flagging. Mark a report as inaccurate, duplicate, already resolved, inappropriate or wrongly rated, with optional notes.
Data collected
Public visitors never create an account. Here is what the app handles.
Submitted with a report (public)
| Data |
Required |
Notes |
| Title, description |
Yes |
Free text written by the reporter. |
| Category and severity |
Yes |
Road, Building, House or Infrastructure; Red, Yellow or Green. |
| Latitude and longitude |
Yes |
Entered by hand, picked on the map, or filled from the device's GPS. |
| Address |
No |
Free text. May be auto-filled with coordinates when using current location. |
| Photo |
No |
Resized in the browser to at most 1280 px and re-encoded as JPEG before upload. Re-encoding drops EXIF metadata such as camera details and embedded GPS. |
| Reporter name |
No |
Defaults to "Community Member" if left blank. |
All of the above is displayed publicly on the map, in the feed and in the report details. Don't include personal information in a report, and avoid photos that show faces, license plates or house numbers.
Submitted when flagging a report
- The selected reason and optional notes.
- The server tracks the flag count, flag state, status (active, under review, verified, resolved, dismissed) and created/updated timestamps for each report.
Location
- The device's location is requested only when you press Location, use Use Current Location, or when the map first loads. It is used to center the map and sort reports by distance.
- When available, your coordinates are sent to the API as query parameters to sort nearby reports. The front end doesn't store them, so check what the server logs.
Stored in your browser
- A cached copy of the last loaded reports (
localStorage), used only when the network is unavailable.
- Admin session data, described above.
Third parties
- Google Analytics (
gtag) collects anonymous usage data on page views.
- Google Fonts serves the typeface.
- CARTO and Esri serve map tiles, so they receive your IP address and the map area you view.
Notes
- Reports are crowdsourced and unverified until an admin marks them Verified. Don't rely on them for emergencies; call local emergency services.
- Photos are stored as data URLs, so keep the API's request size limits in mind.
Author
Isaiah Noel Pulido Salazar, inpsstudio